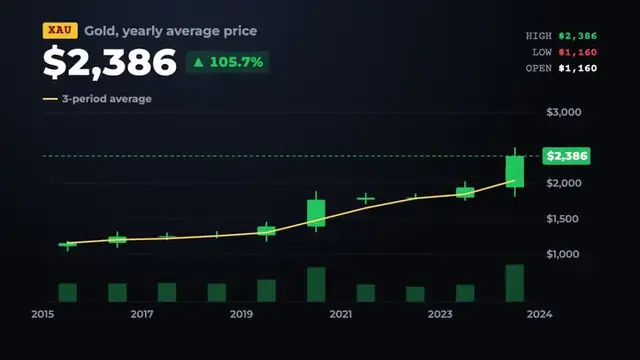
Faceless finance and business channels explain money: how a company went from first to bankrupt, why gold keeps rising, what the most expensive hotel room in the world costs. The pictures matter less than in nature or history. What carries these videos is numbers made visible: a price chart, a bar race, a dollar figure that lands on screen as the narrator says it.
This guide compares six AI video tools for faceless finance and business channels. VidGenn, which publishes this guide, is our pick for documentary-style business stories and explainers. For Shorts and for the lowest monthly bill, other tools fit better, and we name them.
How we checked: prices and features come from each vendor's own pricing page on 6 November 2026 (US dollars, monthly). This guide is about making videos, not financial advice.
Quick picks
- Best overall for business stories and explainers: VidGenn, with stock, bar, line and money graphics from $19 a month
- Best for research and scripts: Subscribr
- Best for finance Shorts: StoryShort
- Lowest monthly price: InVideo AI, from $9 (credits; minutes not stated)
- Best free trial: Pictory (14 days, 10 minutes)
- Best for many minutes a month: VidNext
What a finance video needs
Charts built from real numbers
A finance video without charts is a podcast. Look for a tool that turns the numbers in your script into graphics: candlesticks for a price, bars for a comparison, a line for growth, a big figure for the punchline. And use numbers you may publish: the World Bank licenses most of its data under CC BY 4.0, and Our World in Data lets you reuse its charts with a citation.
Accuracy and a date on every number
Prices move. Say when each figure is from ("as of 2024"), keep the source, and avoid telling viewers what to buy. A tool that lets you read and edit every line of the script before rendering protects you from a confident AI sentence with the wrong year.
Pictures of the business
Between charts, viewers want to see the company, the city, the product. Stock libraries cover offices, trading floors, factories and cities; archive photos cover company history.
What finance channels earn
In AIR Media-Tech's data from 300 monetized channels, Business & Finance had a median RPM of $2.01, but on fewer than ten channels, so read it as directional, and the middle half ranged from $0.73 to $5.17. Where your viewers live and how long they watch move RPM more than the label on the niche. Our guide to whether faceless channels make money does the maths.
The six tools compared
| Tool | Starts at | Price per minute | Longest video | Visuals | Free trial |
|---|---|---|---|---|---|
| VidGenn | $19/month | $0.63 → $0.44 | 20 min | Licensed footage + charts, stats and money graphics | No |
| Subscribr | $99/month | $1.50 → $1.20 | 3 hours | AI-generated, 14 styles | Free plan, no video |
| StoryShort | $39/month (Shorts); $129 for long | about $0.81 → $0.48 (long) | 10 min from an idea | AI-generated | Free sign-up; videos need a plan |
| InVideo AI | $9/month | not stated | not stated | AI-generated images and clips | No |
| Pictory | $29/month | $0.97 → $0.66 | 30 min | Getty and Storyblocks stock + AI images | 14 days, 10 min |
| VidNext | $49/month | $1.63 → $1.00 | about 30 min | Not stated on its pricing page | No |
VidGenn: best overall for business stories
VidGenn turns a topic like "inside the world's most expensive hotel rooms", or your own script, into a 3 to 20 minute documentary. It writes a researched script you can edit, narrates it with one of 24 ElevenLabs voices, finds licensed footage for each sentence, and puts a motion graphic on each fact.
The "Numbers & charts" group of its 184+ graphics is built for this niche: stock candles, line and bar charts, bar races, rankings and podiums, donuts and waffles, money stacks, receipts, and big animated figures.

- Best for: business history, company stories, economics explainers and "how much does it cost" videos.
- Good: the lowest price per minute here, charts and money graphics built from your numbers, full control of the script.
- Watch out: no Shorts, no free trial, English only, 20 minutes at most.
Price: Starter $19 a month for 30 minutes; Pro $79 for 180 minutes ($0.44 a minute). See plans.
Subscribr: research and scripts
Subscribr researches topics across 35 million YouTube videos and writes scripts and thumbnails; its video plans make videos up to 3 hours with AI-generated visuals. Finance channels that live on picking the right topic may value the research most.
- Good: research, scripts, thumbnails; a free plan for ideas.
- Watch out: video from $99 a month; all sales are final.
StoryShort: finance Shorts
Money tips and "did you know" business facts work well as Shorts. StoryShort is built for Shorts from $39 a month, with long videos on its $129 plan and up.
- Good: Shorts and long videos; 40% off yearly; credits roll over.
- Watch out: AI-generated visuals; long videos from an idea run 8 to 10 minutes.
InVideo AI: the lowest monthly price
InVideo AI is a general AI video editor from $9 a month. It sells credits for AI images and clips, so the cost of a finished minute isn't stated.
- Good: the lowest entry price; many AI models; 50% off yearly.
- Watch out: price per finished video unclear; no stated video length; generated rather than real pictures.
Compare: VidGenn vs InVideo AI.
Pictory: explainers from your script
Pictory is made for marketing and explainer videos, turning scripts, articles and links into videos with Getty and Storyblocks stock. A finance explainer from a written article is a natural fit, and the 14-day trial makes 10 minutes of 720p video.
- Good: free trial; stock of offices, cities and money; up to 40% off yearly.
- Watch out: no charts built from your numbers; no refunds.
VidNext: many minutes a month
VidNext sells minutes of finished video, with plans up to 1,000 minutes a month and videos up to about 30 minutes. Its pricing page doesn't describe the visuals, so ask for a sample.
- Good: big plans; first redo and export free; top-ups never expire.
- Watch out: $49 for 30 minutes; credits back only for technical failures.
Example: the $300,000 hotel room
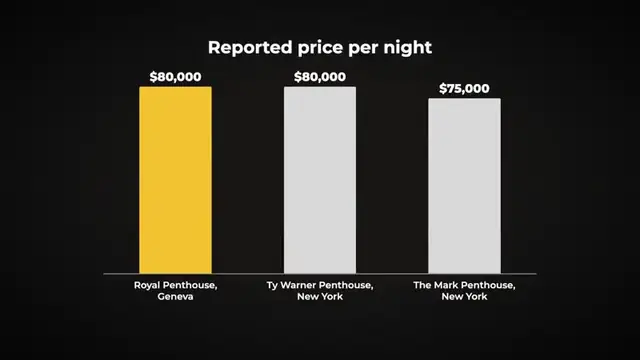
Our hotel example asks what the world's most expensive hotel rooms cost. VidGenn wrote the script, found footage of the hotels and their cities, and turned the prices into graphics: the $80,000 night above, then a bar chart comparing the three most expensive suites.

How to choose
- Long explainers or Shorts? Long: VidGenn (up to 20 minutes, lowest price per minute). Shorts: StoryShort.
- Charts from your numbers? VidGenn builds them on each fact; general editors leave them to you.
- Research help? Subscribr.
- Smallest monthly bill? InVideo AI from $9, though the price per finished minute isn't stated.
Make your first business documentary
Common questions
What is the best AI for faceless finance YouTube videos?
For long business stories and explainers, VidGenn: footage plus charts and money graphics built from your script, from $0.63 a minute. For Shorts, StoryShort; for research, Subscribr.
Where can I get data for finance charts?
The World Bank licenses most of its datasets under CC BY 4.0, and Our World in Data allows reuse of its charts with a citation. Company reports and official statistics are good sources too. Always say the date of a number.
Do faceless finance channels make money?
They can, but RPM varies a lot. In AIR Media-Tech's data, Business & Finance had a $2.01 median RPM on a small sample, with the middle half of channels between $0.73 and $5.17. Audience country and watch time matter as much as the niche.